6 Gene expression profile
Visualizing expression profiles for one or more genes using bars, lines, boxplots and heatmap plots.
6.1 Overview the structure of module page
Please check 5.1 for more infos.
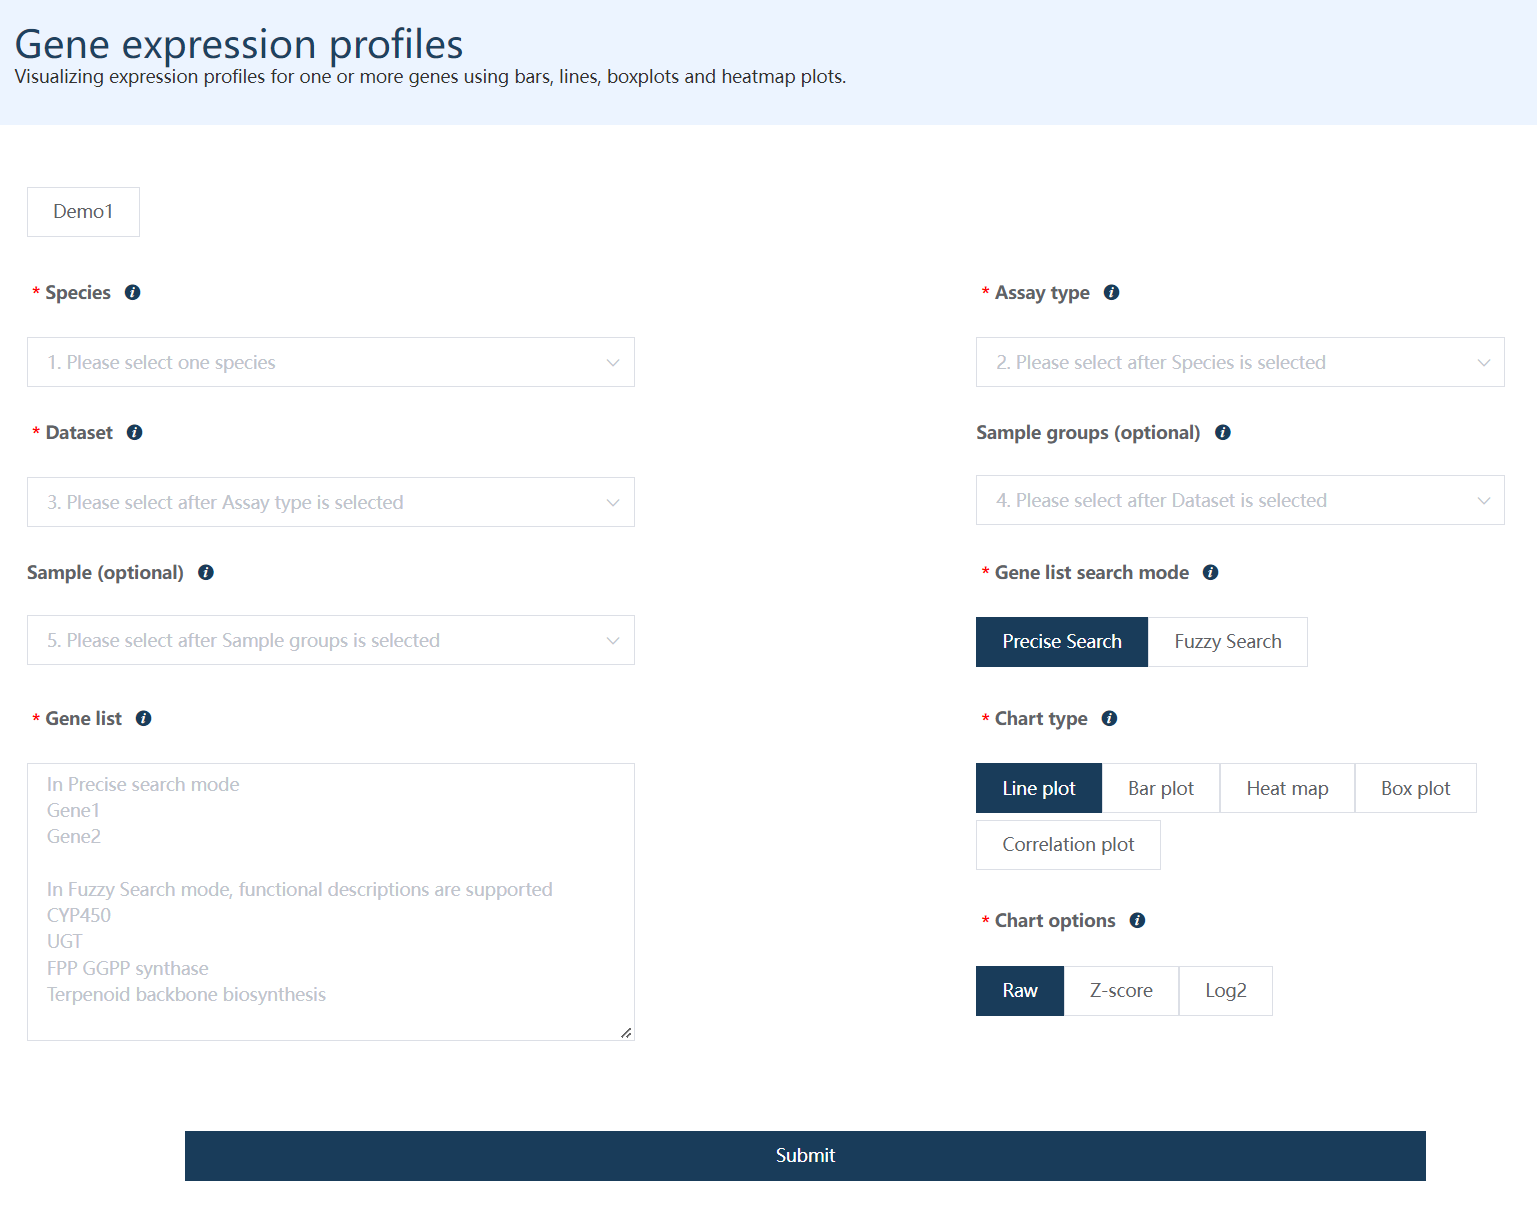
Figure 6.1: A screenshot of the form structure.
6.2 Choose options for each required parameters step by step
Just select each parameter sequentially as labeled in the figure.
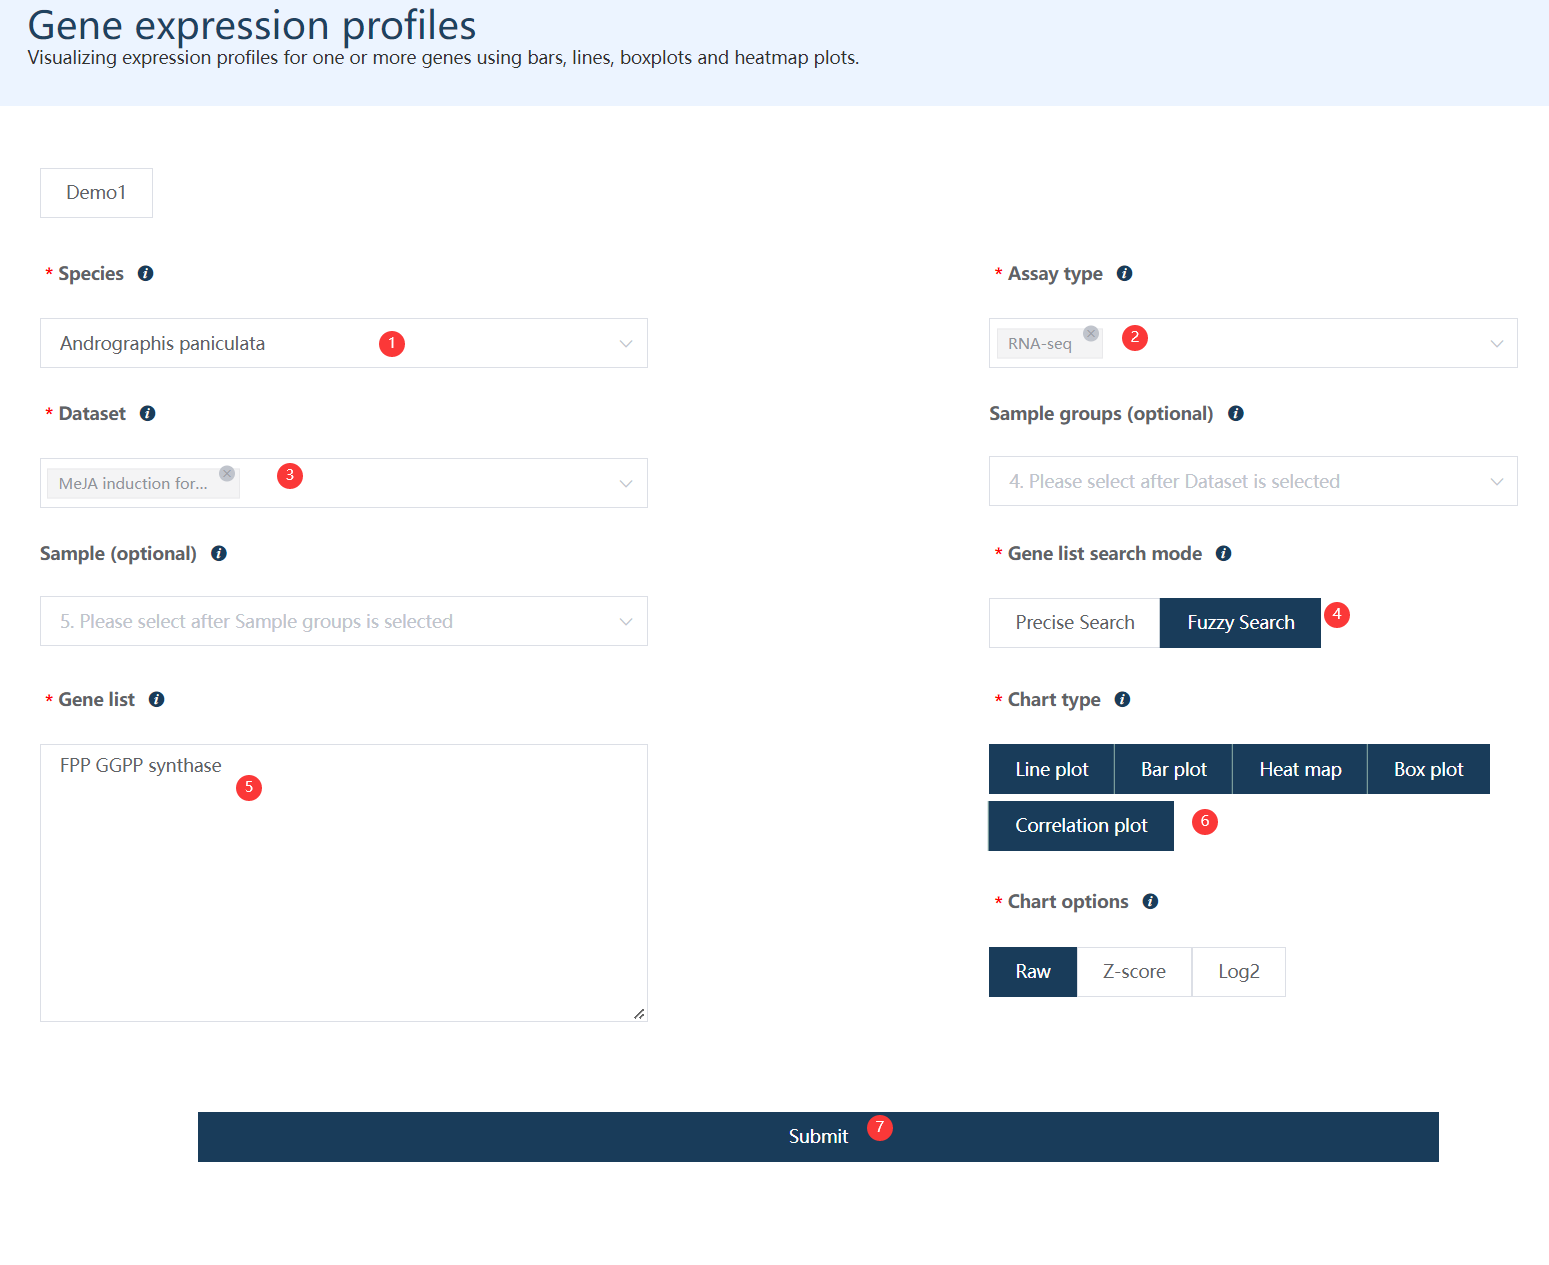
Figure 6.2: A screenshot of the one type of selections for gene expression profile analysis.
Clicking Submit, after several seconds, 4 plots are generated below.
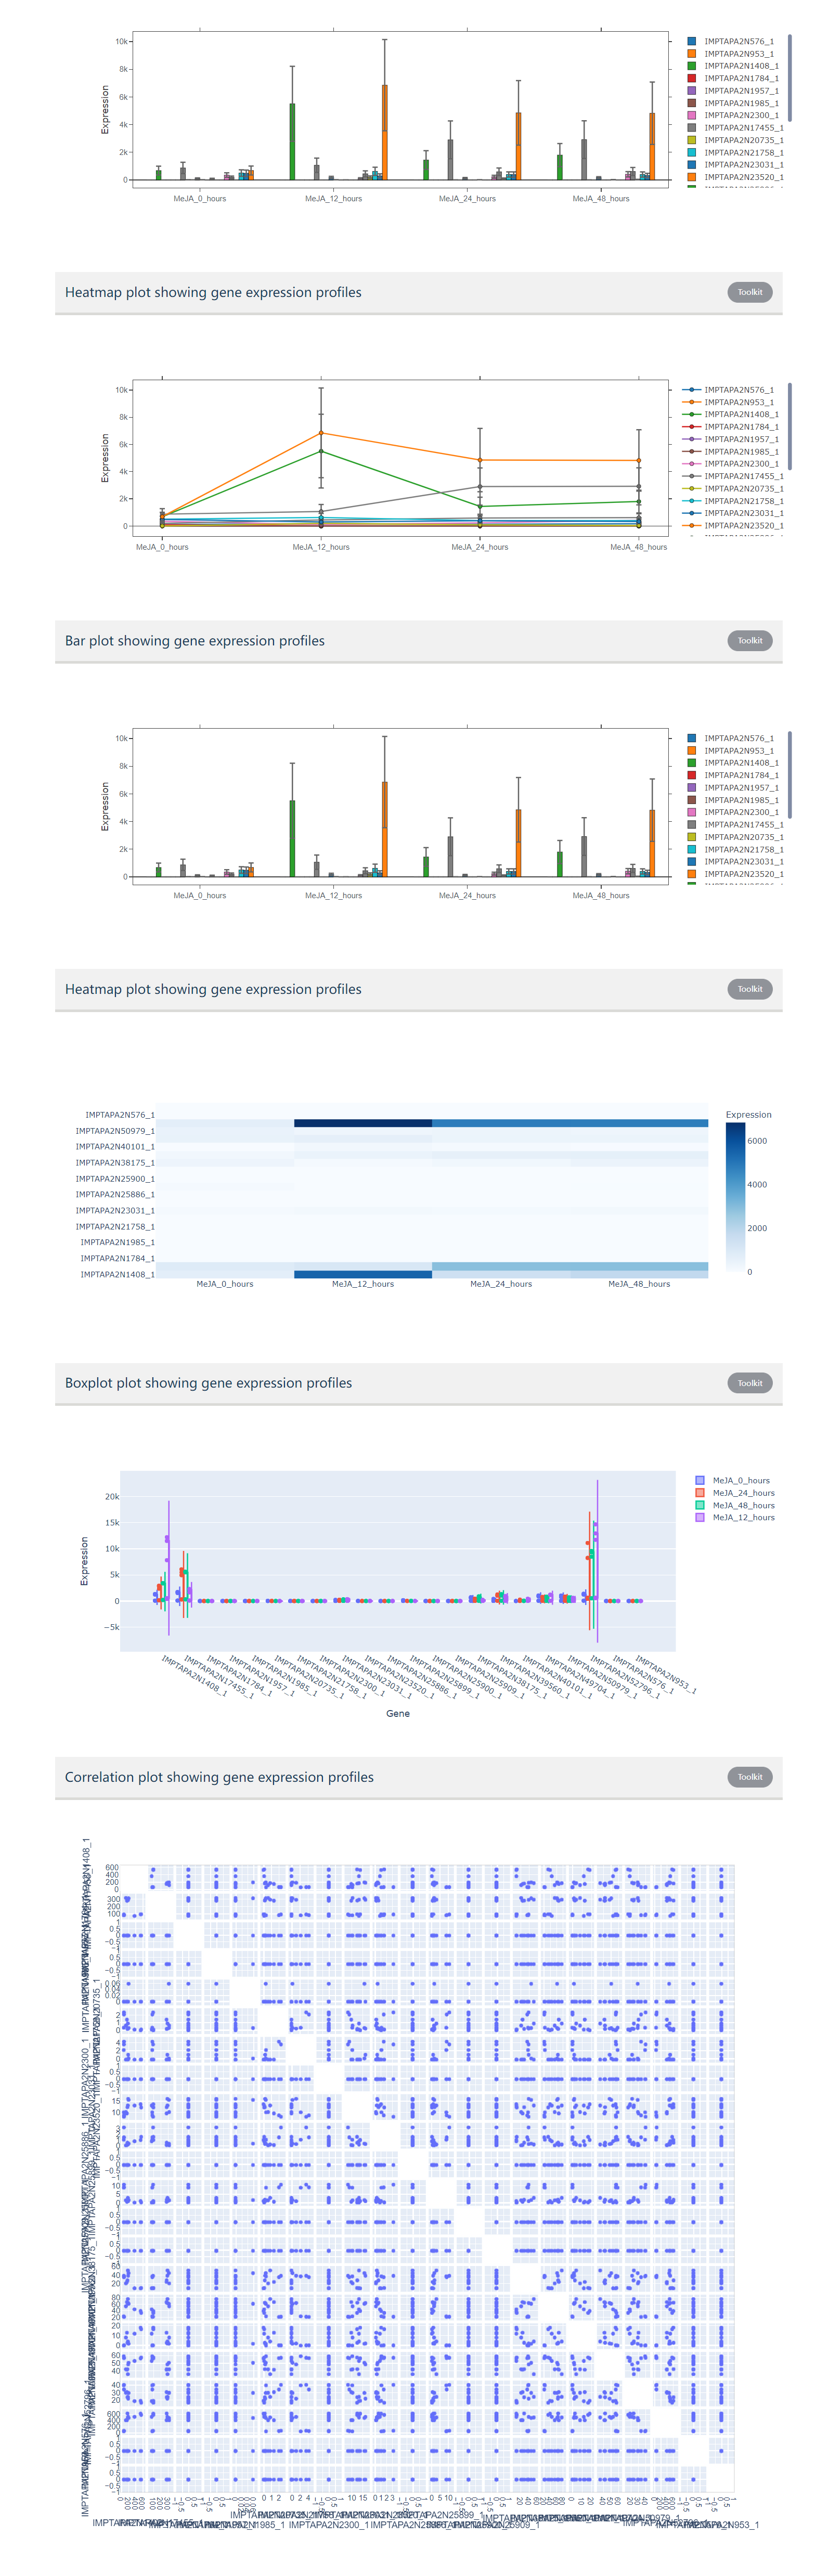
Figure 6.3: The line plots and bar plots show the mean expression value of genes in each sample group and the standard deviation values. Heatmap showing expression profiles for all genes in each sample group. Boxplot shows the expression distribution of genes in each sample group. The correlation plot shows paired-expression correlation profiles for all genes.
6.3 The demo button
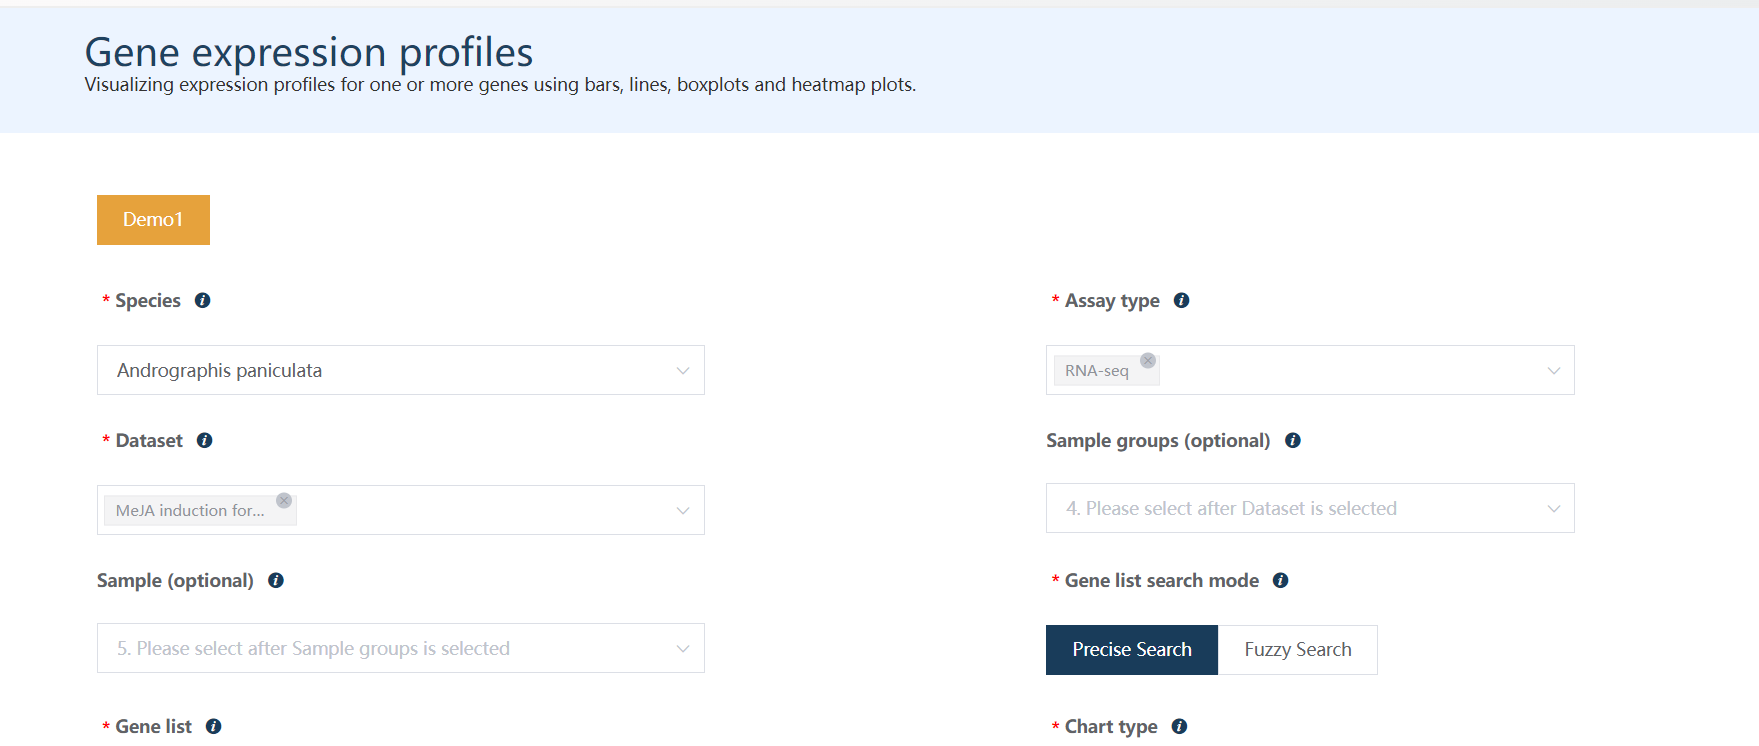
Figure 6.4: Click the Demo1 button at left-top corner for quick access.
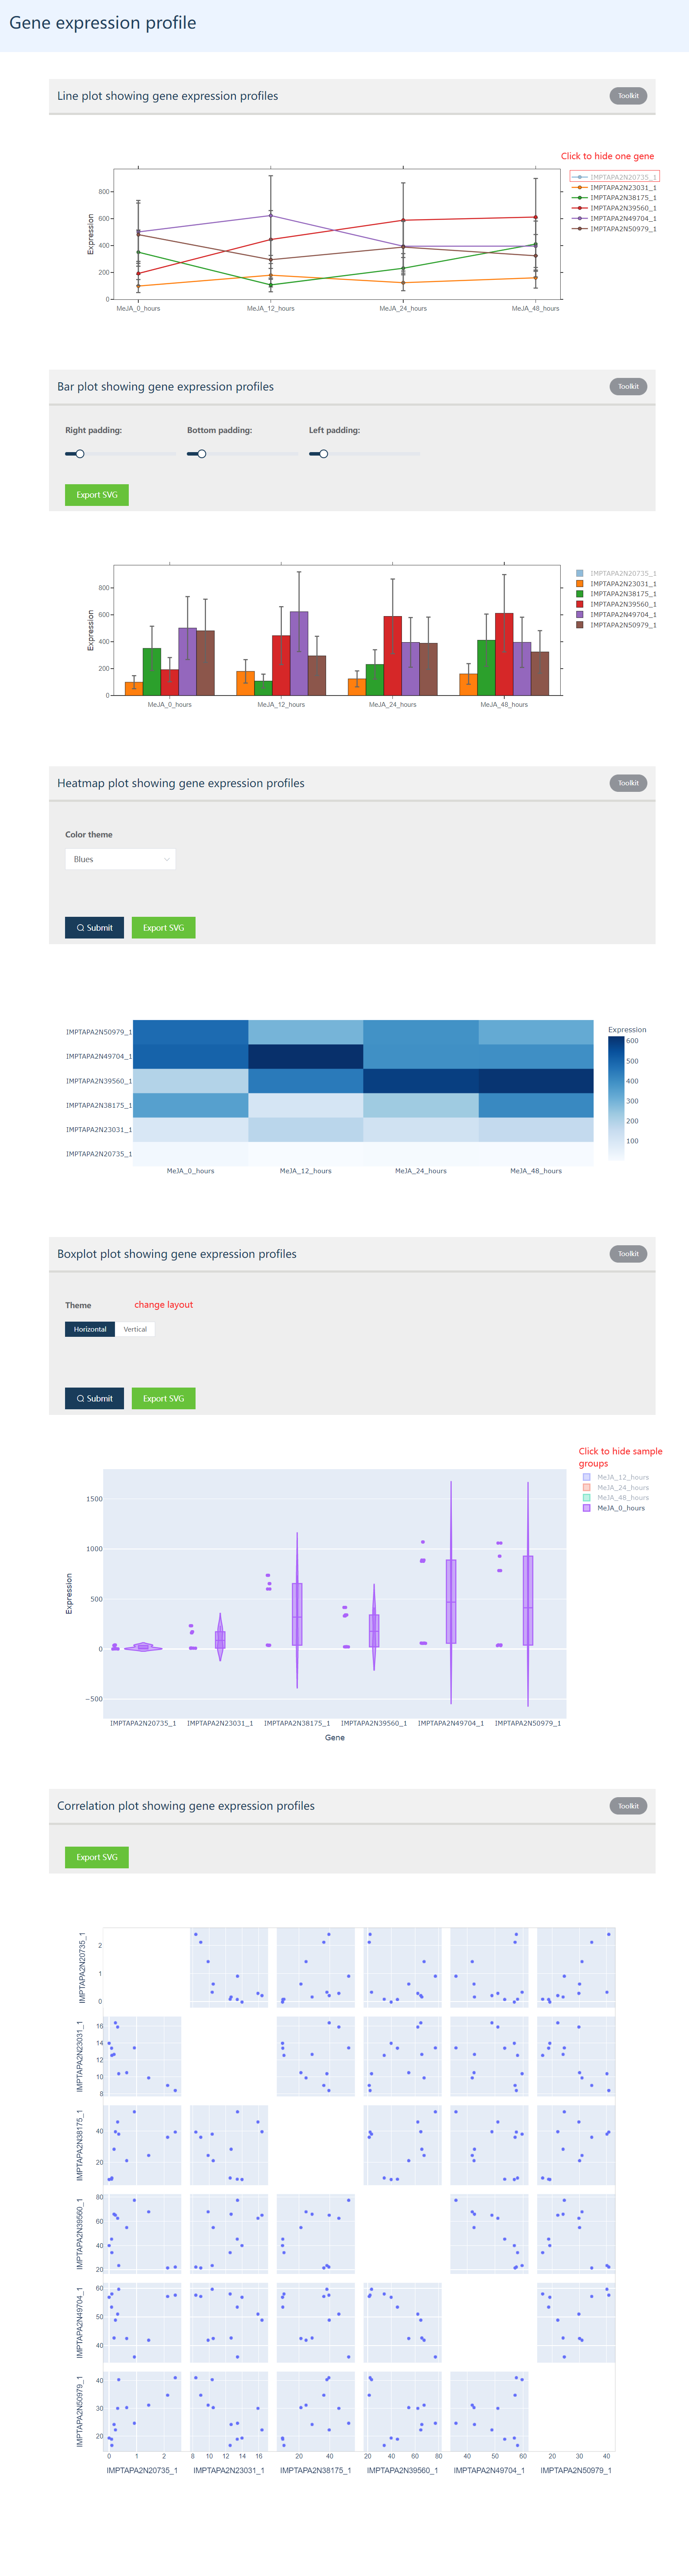
Figure 6.5: The demo results showing line plots, bar plots, boxplots, heatmap and correlation plot. The line plots and bar plots show the mean expression value of genes in each sample group and the standard deviation values. Heatmap showing expression profiles for all genes in each sample group. Boxplot shows the expression distribution of genes in each sample group. The correlation plot shows paired-expression correlation profiles for all genes.
6.4 The precise search and fuzy search mode
- In Precise search mode: only gene ids or transcript ids separated by newlines are supported.
Gene1
Gene2
Gene3- In Fuzzy Search mode, searching genes by functions, pathways, gene ontology are supported. For example one can search all
CYPgenes or other function genes as listed below.
CYP450
UGT
FPP GGPP synthase
Terpenoid backbone biosynthesis