9 GSEA enrichment analysis
Performing GSEA analysis based on fgsea package.
9.1 Principles of gene set enrichment analysis (GSEA)
- Given a sorted gene lists (
L) (normally sorted by log2 transformed fold change values) - Given a pathway
Swith multiple geness - The aim of GSEA is to whether check those gene
sare ranomly distributed in listLor enriched in the top and botton region of gene listL
Note
Enrichment score (ES): We calculate an enrichment score (ES) that reflects the degree to which a set S is overrepresented at the extremes (top or bottom) of the entire ranked list L. The score is calculated by walking down the list L, increasing a running-sum statistic when we encounter a gene in S and decreasing it when we encounter genes not in S. The magnitude of the increment depends on the correlation of the gene with the phenotype. The enrichment score is the maximum deviation from zero encountered in the random walk; it corresponds to a weighted Kolmogorov–Smirnov-like statistic. (directly copied from ref2)
normalized enrichment score (NES): normalize the ES for each gene set to account for the size of the set

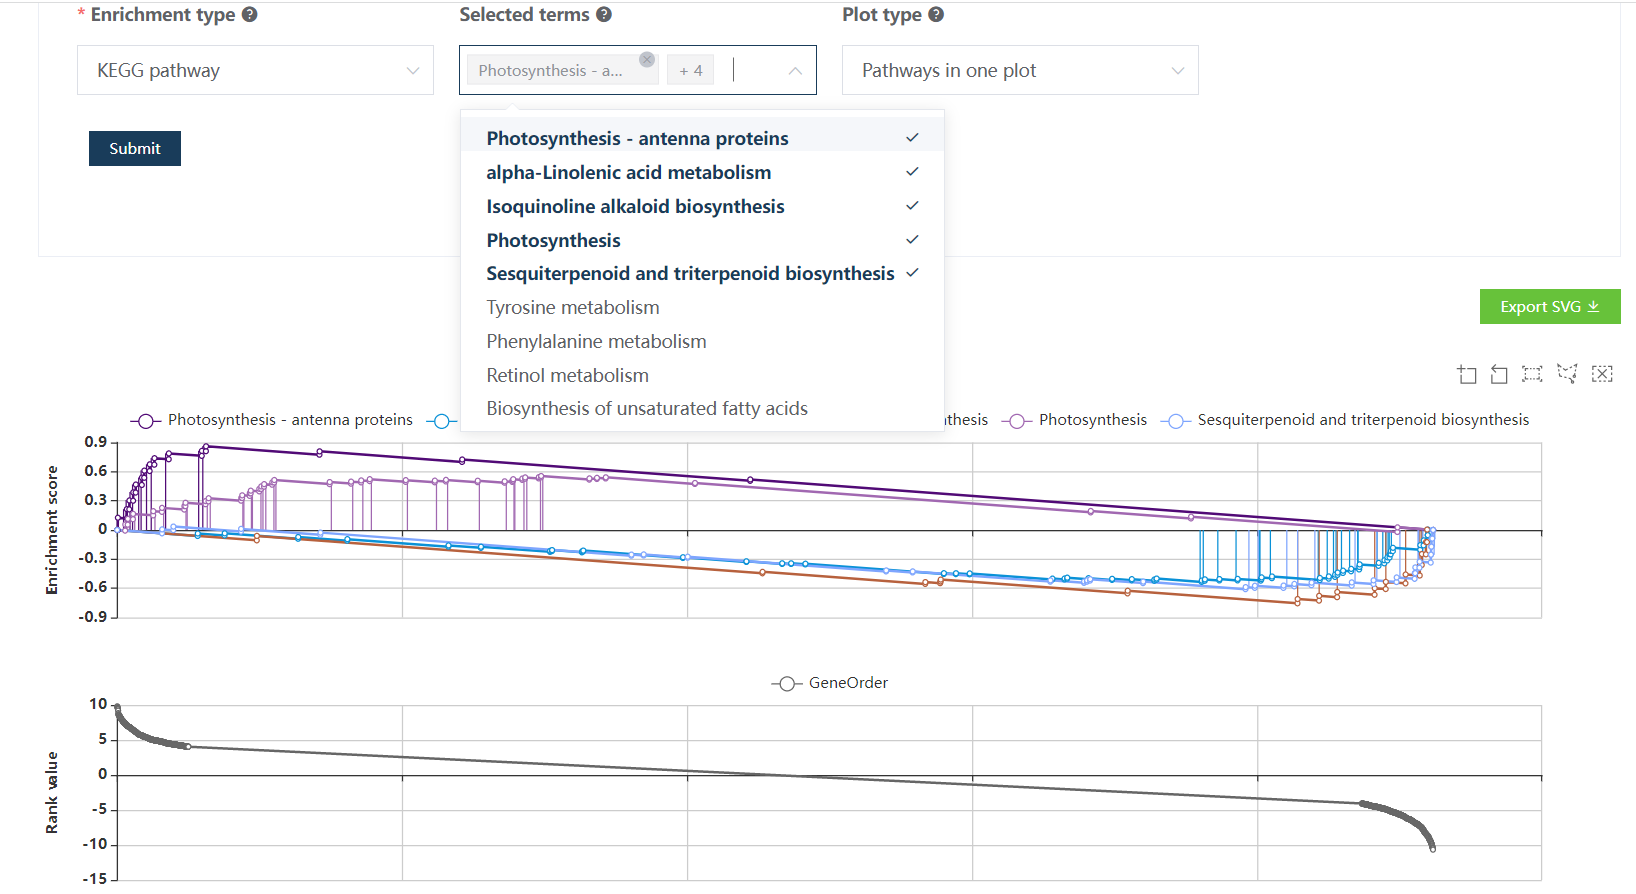
9.2 Choose options for each required parameters step by step
Just select each parameter sequentially as labeled in the figure (or simply just click the Demo1 button).

Figure 9.1: A screenshot of the one type of selection for GSEA enrichment based on KEGG annotation for all genes identified in chapter 5.
Clicking Submit, after several seconds, one GSEA plot and one table are generated below.
Note
Mousing over the plots would see the names of leading edge genes as well as other genes in showing pathways.

Figure 9.2: The top plot shows the GSEA enrichment profiles of two top-enriched pathways. Vertical lines representing leading-edge genes. The bottom plot shows the rank distribution of all genes (actually only top 500 and bottom 500 genes are shown to accelerate the result loading).
Note
Users are allowed to choose which enriched terms to be visualized in the GSEA plot.
Also the visualization ways could be changed.
Note
Users could check gene detail information by clicking gene names in the enrichment table.
9.3 References
- Fast gene set enrichment analysis. Gennady Korotkevich, Vladimir Sukhov, Nikolay Budin, Boris Shpak, Maxim N. Artyomov, Alexey Sergushichev doi: https://doi.org/10.1101/060012
- Gene set enrichment analysis: A knowledge-based approach for interpreting genome-wide expression profiles. Aravind Subramanian, Pablo Tamayo, Vamsi K. Mootha, Sayan Mukherjee, Benjamin L. Ebert, Michael A. Gillette, Amanda Paulovich, Scott L. Pomeroy, Todd R. Golub, Eric S. Lander, and Jill P. Mesirov September 30, 2005 https://doi.org/10.1073/pnas.050658010